Comparing Artifacts by Analysis Units
Using graphs, the artifacts in the Williams farmstead assemblage can be compared by analysis units using the five main functional groups. The three graphs shown in this section provide some tantalizing patterns that must be investigated further by delving into details of subgroups and artifact classes. Although discussion of details would be too lengthy for this exhibit, we can offer a few examples of some interesting broad patterns.
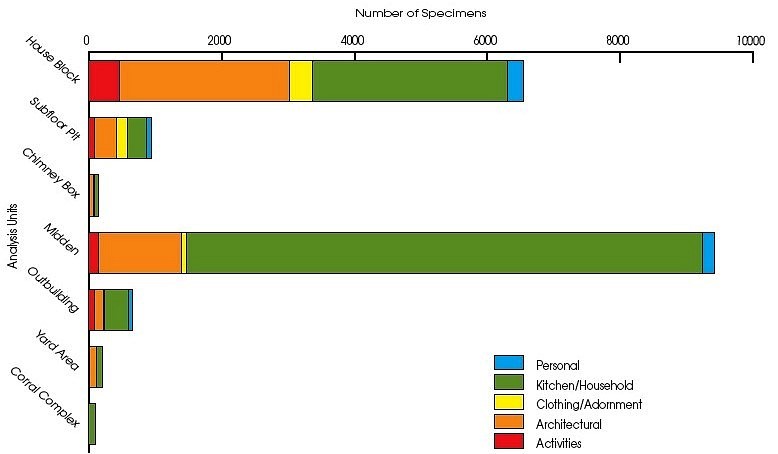
The first graph, shown above, depicts raw numbers and shows that 88.6% of all the artifacts were recovered from the midden (52.3%) and the house block (36.3%). The two dominant functional groups are Kitchen/Household (64.4% of the assemblage) and Architectural (24.7%). This pattern is not unexpected for domestic sites like a family farmstead.
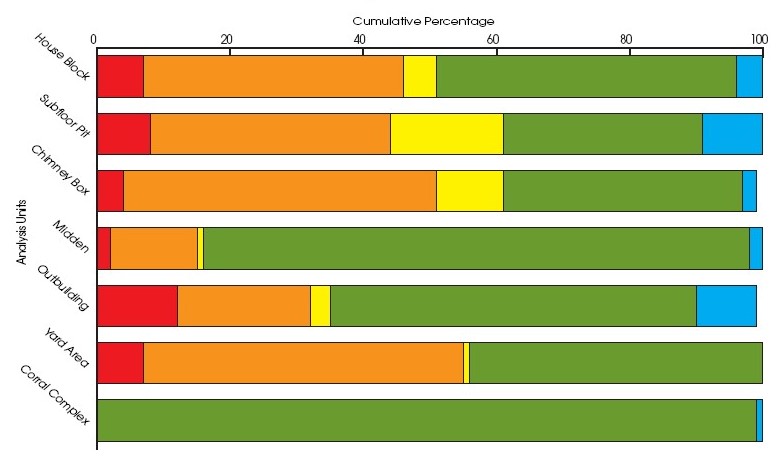
The second graph shows cumulative percentages of the artifact by functional groups, which allows for more direct comparisons of what was found in each area. This data reveal that Clothing/Adornment artifacts were most frequent in the house block, including the chimney and storage pit, while the Activities artifacts were most frequent in the outbuilding. The latter includes a number of items related to farming and ranching activities.
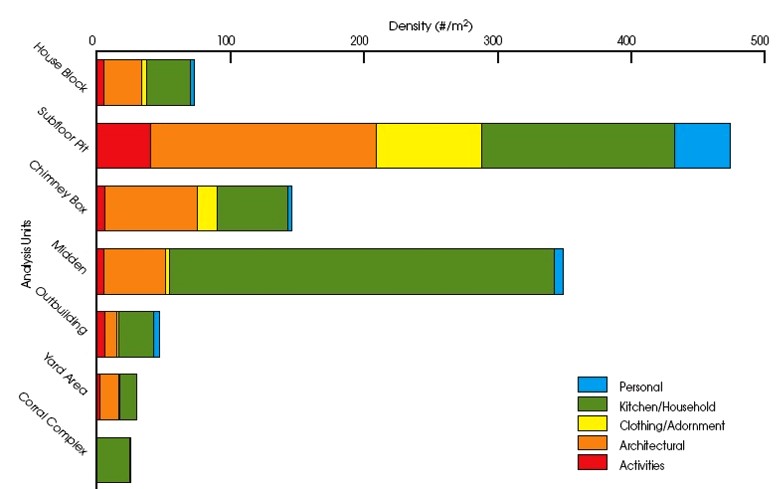
The third graph compares the densities of artifacts, per square meter, by analysis units using the five main functional groups. These data show that the subfloor storage pit and the midden had the highest concentrations of artifacts, while the house block had a moderate artifact density. In contrast, artifact densities in the yard area and corral complex were very low.