Neutron activation analysis of ceramics at University of Missouri Research Reactor (MURR), consists of two irradiations and a total of three gamma counts, which constitutes a superset of the procedures used at most other NAA laboratories. A short irradiation is carried out through the pneumatic tube irradiation system. Samples in the polyvials are sequentially irradiated, two at a time, for five seconds by a neutron flux of 8 x 10¹³ n cm-2 s-1. The 720-second count yields gamma spectra containing peaks for short-lived elements. The samples encapsulated in quartz vials are subjected to a 24-hour irradiation at a neutron flux of 5 x 10¹³ n cm-2 s-1. This long irradiation is analogous to the single irradiation utilized at most other laboratories. After the long irradiation, samples decay for seven days, and then are counted for 2,000 seconds (the “middle count”) on a high-resolution germanium detector coupled to an automatic sample changer. The middle count yields determinations of seven medium half-life elements. After an additional three- or four-week decay, a final count of 9,000 seconds is carried out on each sample. The latter measurement yields 17 long half-life elements. Elemental concentration data from the two irradiations and three counts (a total of 33 elements) are assembled into a single tabulation and stored in a dBASE file along with descriptive information available for each sample.
The goal of quantitative analysis of the chemical data is to recognize compositionally homogeneous groups within the analytical database. Based on the “provenance postulate”, such groups are assumed to represent geographically restricted sources or source zones. The location of sources or source zones may be inferred by comparing the unknown groups to knowns (source raw materials) or by indirect means. Such indirect means may include the “criterion of abundance” or arguments based on geological and sedimentological characteristics. Initial hypotheses about source-related subgroups in the compositional data can be derived from non-compositional information (e.g., archeological context, decorative attributes) or from application of pattern-recognition techniques to the chemical data. Principal component analysis (PCA) is a technique that can be used to recognize patterns (i.e., subgroups) in compositional data. PCA provides new reference axes that are arranged in decreasing order of variance subsumed. The data can be displayed on combinations of these new axes, just as they can be displayed relative to the original elemental concentration axes. PCA can be used in a pure pattern-recognition mode to search for subgroups in an undifferentiated data set or in a more evaluative mode to assess the coherence of hypothetical groups suggested by other criteria (e.g., archaeological context, decoration). Generally, compositional differences between specimens can be expected to be larger for specimens in different groups than for specimens in the same group, and this implies that groups should be detectable as distinct areas of high point density on plots of the first few components.
One strength of PCA is that it can be applied as a simultaneous R- and Q-mode technique, with both variables (elements) and objects (individual analyzed samples) displayed on the same set of principal component reference axes. The two-dimensional plot of element coordinates on the first two principal components is the best possible two-dimensional representation of the correlation or variance-covariance structure in the data. Small angles between vectors from the origin to variable coordinates indicate strong positive correlation, angles close to 90o indicate no correlation, and angles close to 180o indicate negative correlation. Likewise, the plot of object coordinates is the best two-dimensional representation of Euclidean relations among the objects in log-concentration space (if the PCA was based on the variance-covariance matrix) or standardized log-concentration space (if the PCA was based on the correlation matrix). Displaying objects and variables on the same plots makes it possible to observe the contributions of specific elements to group separation and to the distinctive shapes of the various groups. Such a plot is called a "biplot" in reference to the simultaneous plotting of objects and variables. The variable interrelationships inferred from a biplot can be verified directly by inspection of bivariate elemental concentration plots (note that a bivariate plot of elemental concentrations is not a biplot").
Whether or not a group is discriminated easily from other groups can be evaluated visually in two dimensions or statistically in multiple dimensions. A metric known as Mahalanobis distance (or generalized distance) makes it possible to describe the separation between groups or between individual points and groups on multiple dimensions. The Mahalanobis distance of a specimen from a group centroid is:
where y is the 1 x m array of logged elemental concentrations for the individual point of interest, X is the n x m data matrix of logged concentrations for the group to which the point is being compared with being its 1 x m centroid, and Ix being the inverse of the m x m variance-covariance matrix of group X. Because the Mahalanobis distance takes into account variances and covariances in the multivariate group, it is analogous to expressing distance from a univariate mean in standard deviation units. Like standard deviation units, Mahalanobis distances can be converted into probabilities of group membership for individual specimens. For relatively small sample sizes, it is appropriate to base probabilities on Hotelling’s T2, which is the multivariate extension of the univariate Student’s t.
As a first step in interpreting the data, a Euclidean distance search was used to scan the entire MURR databank of 35,000+ ceramic analyses from around the world. The purpose of this search was to identify individual specimens that are compositionally similar to the individual specimens in the data set of interest. The technique is straightforward. Euclidean (straight-line) distances are calculated between a given individual specimen and all specimens in the comparison databank, and the top specimens are extracted for comparison. Actually, the distance measure for which minima are sought is the average Euclidean distance:
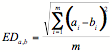
where a and b are vectors containing m elemental concentrations for the two individual specimens being compared. The vast majority of samples identified as being compositionally similar to the pottery samples of interest were samples analyzed for Dr. Darrell Creel, Director of the Texas Archeological Research Laboratory (TARL) in Austin, Texas. With the exception of one sample identified as being similar to pottery from the El Paso, Texas, area, most samples suggested similarities to the Central Texas-1 and Central Texas-2 reference groups or other unassigned pottery from this area.