Geometric Morphometrics and Clovis Points: |
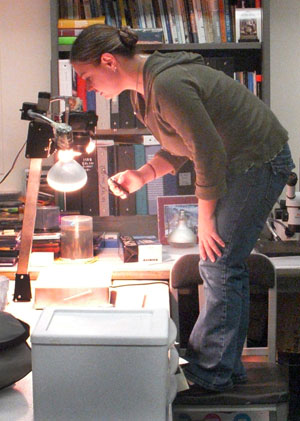
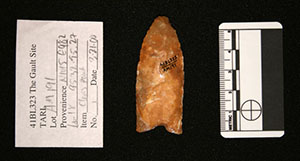
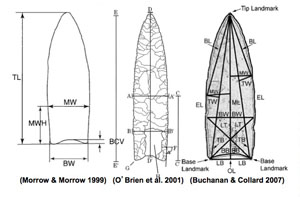
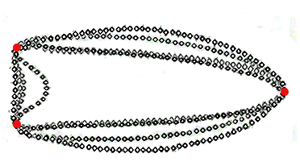
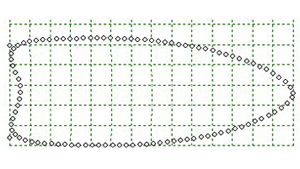
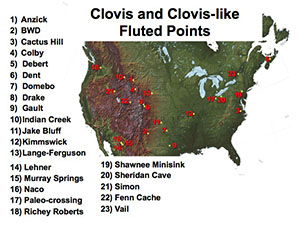
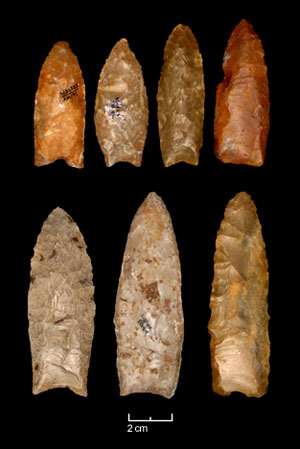
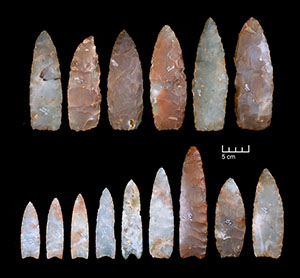
Archeologists can learn a great deal about how early people lived from their stone tools. Researchers who specialize in stone tool, or lithic, analyses are known as lithicists, and they use a variety of methods ranging from geochemical studies to morphometric approaches to understand past human behavior and technology. Heather Smith, an archeologist and Associate Editor of Texas Beyond History, is a lithicist who uses these approaches in her research on the human occupation of the American continents that occurred at the end of the last Ice Age. By comparing patterns in the shape and technology of stone tools, specifically, early fluted projectile points found across the continent known as Clovis, she hopes to identify the "normative" shape, or mental template, that dictated prehistoric tool manufacture, repair goals and methods. These patterns also may provide evidence of prehistoric human movement or the flow of goods or ideas during the initial occupation of the American continents. In this Spotlight feature, Smith explains one of the methods she uses and offers examples of the more interesting findings in her study of Clovis points, which included over 100 artifacts from 23 Clovis sites across the U.S. Although more technical than many of our features on Texas Beyond History, it provides insight into some of the current types of quantitative methods being used in stone tool analysis. By Heather Smith The Clovis projectile point represents the earliest and most widespread evidence of a uniform stone technology found in the archeological record of North America. Dating approximately to a 200-500 year time period around 13,000 radiocarbon years before present, their presence at archeological sites across the continent suggests they were left behind by a group or many groups of related peoples who were part of a single culture. These points were used as weapons affixed to the end of spears or lances and in some cases also were used as knives. Clovis points typically have a technologically diagnostic flake scar on the base known as a flute, a characteristic which is found only on projectile points dating to the first few thousand years of the human occupation of the western hemisphere. I have travelled to museums and laboratories across Alaska, Canada, and the continental U.S. to study and assemble a data set of hundreds of fluted points to try to determine if there are patterns in the shape of these artifacts, and if so, whether such patterns are organized geographically, suggesting a direction in which first Americans migrated or transmitted technological information to other early groups. For the project discussed below, I analyzed a variety of Clovis point assemblages at the National Museum of Natural History at the Smithsonian Institution and at Texas A&M University Center for the Study of the First Americans. However, one of the most important assemblages of Paleoindian artifacts are the Clovis projectile points from the Gault site in central Texas, curated at the Texas Archeological Research Laboratory (TARL). At the TARL imaging laboratory, I conducted a morphological analysis of a sample of Gault Clovis points using a digital method of morphometric data-capturing and analysis: geometric morphometrics. My findings about this group of Clovis points have been very intriguing. Background of Morphometric AnalysisMorphometric analysis is a quantitative method of measuring the form (size with shape) and shape (shape regardless of size) of objects that exist in two or three dimensions for comparative purposes. Morphometric data consists of shape data, which describe an object's geometric properties regardless of location, scale, and orientation. Traditional morphometric data consists of measurements of length or distances (linear and curvilinear), width, mass, area, and angles, as well as indices such as length/width. These types of measurements typically are taken by hand with calipers, rulers, goniometers, or other instruments and can be used in a variety of analyses. These methods, however, are not able to capture the entire geometry of an object and preserve it throughout analyses. For example, if we are comparing the length/width index of artifacts, we may also wish to simultaneously take into consideration other aspects of shape such as the degree of curve in the tool's blade margins. Another way to examine morphology without loosing details of the original tool shape is to use geometric morphometric analyses. Originally used in the biological sciences, geometric morphometric techniques are being widely used today in many studies of anthropological research from shape analysis of pottery vessels to shape analysis of Australopithecine and early Homo crania. To analyze Clovis projectile points, I use an approach known as landmark geometric morphometrics, which measures shape variation by calculating the relative positions of coordinate landmarks assigned to important structural features on each artifact. The features chosen must be uniform points of reference (i.e., they can be precisely located on every specimen) and adequately represent the object’s structure. In this study, I used a new approach to assigning landmarks: instead of selecting specific features on the artifact, I placed a series of landmarks that represent the artifact’s outline, or planview shape, along the entire perimeter of each artifact. Once the artifact is placed on a grid, the landmarks around the perimeter can be given Cartesian coordinates (each represents an X and Y location on the grid) which are used to produce numerical expressions that describe the shape of each artifact. These expressions can then be analyzed using multivariate statistics to understand how the differences in shape in a collection of artifacts might be explained by other variables such as location or time period, (i.e., their statistical covariation with independent variables). The actual process essentially begins by making original digital photographs of each artifact to document the scale and orientation used in each photograph. Each photograph is then uploaded into a computer program called tpsDig that allows a series of landmarks, or “dots,” to be placed around the perimeter of the artifact. In geometric morphometrics, there are multiple kinds of landmarks used for different purposes, and here I refer to the landmarks placed around the artifact’s outline as semi-landmarks. The same number of semi-landmarks is placed around each artifact so that each of the semi-landmarks correspond to a semi-landmark located at the same relative position on each specimen. The tip and basal corners are also given special landmarks called homologous landmarks, which serve as uniform points of reference for each projectile point.
|
|
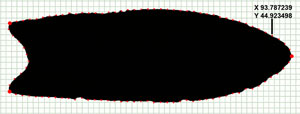
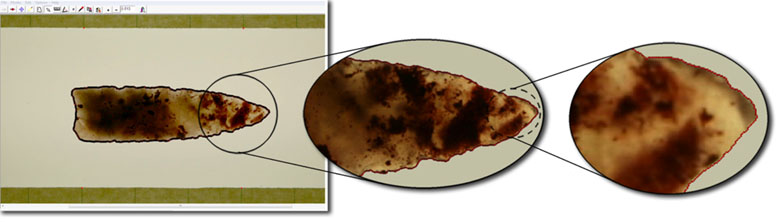
A projectile point in the tpsDig program, with adjacent semi-landmarks placed around the perimeter, is shown in a series of magnifications. |
|
These homologous landmarks are important in the next step of the analysis known as generalized least squares Procrustes superimposition (generalized Procrustes analysis), which is conducted in another computer program, tpsRelw. In this step, each collection, or constellation, of semi-landmarks around the perimeter of the artifacts plus the three homologous landmarks at the tip and basal corners are projected onto a grid (i.e., a Cartesian coordinate system). The next step in Procrustes superimposition is to move each artifact’s constellation of semi-landmarks to the Cartesian origin, X=0, Y=0, so all are centered on the grid (translation) and are seemingly “stacked” one on top of the other, and the three homologous landmarks are in a sense aligned, or super-imposed (rotation). To align the landmarks representing the tip and basal corners, images of small artifacts are, for abstract descriptive purposes, enlarged, and images of large artifacts reduced so that all artifacts become uniform in size. This step allows the differences in shape to be isolated and ultimately removes the element of size from each artifact constellation (scaling). Size is still a valuable characteristic for comparison, however, and it is useful to compare the combination of artifact size and shape in addition to analyses of shape alone. One way that size can be added back into statistical analysis is to treat it as another independent variable by calculating a measure of size for each artifact. For example, an independent measurement of an object’s size could be volume, area, or weight. A common measure of size used in landmark-based geometric morphometric approaches is centroid size, which is acquired by calculating the square root of the sum of squared distance of a series of measured landmarks to their common centroid. As each of the semi-landmarks correspond to a semi-landmark located at the same position on each artifact, the coordinates for each corresponding semi-landmark are used to calculate a mean semi-landmark location for each. The mean landmark locations can be used to produce a mean shape for the entire data-set. Next, tpsRelw calculates space between the positions of each original semi-landmark and the mean position of the corresponding semi-landmarks for each artifact. Equations are generated to represent the location of each original semi-landmark relative to the mean semi-landmark’s location. Termed relative warp scores, the collection of scores generated for each semi-landmark represents the shape of each artifact relative to the mean shape and can be used in statistical analyses to identify variability or patterns in shape in a data set. Another way to describe how this all works is to focus on the use of the word, warp. It is useful to imagine that the grid is actually a plane, or plate, and the mean positions of semi-landmarks used to produce a mean shape rest on a grid that is comfortably perpendicular, as shown in the figure at right. As the shape of each artifact varies, represented by the different positions of the semi-landmarks, you do not see the landmarks actually move on the grid, but the grid stretches, or warps, to accommodate the different locations of the original semi-landmarks. The warping or deformation of the grids is represented by mathematical expressions that describe the bending of the grid axes. When these are combined with the mean coordinates of each landmark (when grid axes are in the perpendicular position), they provide mathematical expressions that describe the positions of each artifact’s semi-landmarks relative to the semi-landmarks’ mean positions and produce relative warp scores. The mathematical expressions actually describe the bending of the grid, or bending energy imposed on the grid, as it accommodates variation in shape. The relative warp scores describe the way in which each artifact’s outline shape varies from mean shape and can be used as principal components for use in multivariate statistical analyses. Another advantage of geometric morphometrics is that you also can generate visual output of the shape differences represented by the relative warp scores. Geometric Morphometrics: A Case StudyIn a 2010 study, I evaluated a fluted projectile point sample that included artifacts from sites that were either confidently dated to the Clovis time period or were from cache sites comprised of morphologically diagnostic Clovis points. Questions I hoped to address were:
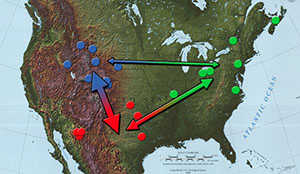
To be included in the analysis, projectile points had to be complete (unbroken) to guarantee that uniform features were available to place homologous landmarks (i.e., they needed to have a tip and both basal corners), and they had to have been recovered from archeological sites either associated with a reliable radiocarbon date corresponding to the Clovis time period or included in a cache with diagnostic Clovis-type artifacts. The final data set included over 100 artifacts from 23 Clovis sites from across the U.S. Multivariate analysis of variance (MANOVA) was carried out using the relative warp scores generated from geometric morphometric data to test for variability in shape within the entire data-set. Results indicated there were significant shape differences between regions, and a significant dichotomy was apparent between regions in the East and regions in the West. In other words, this variability in shape was not random in the data set but patterned geographically, with certain shape characteristics specific to region. This pattern is visible in the dendrogram generated in multivariate cluster analysis shown at right. Clovis points in the northwest (colored blue in the map at right) were found to have more shape characteristics in common with Clovis points from the more southwestern sites (red), which includes the Gault site, than any of these western sites have with sites in the northeast (green). Clovis points from the Gault site were found to be closely associated with other points from the southwest region. This could suggest that these sites were occupied by a single group of people, who moved long distances across the landscape, or by closely related groups of people who used the same methods to manufacture Clovis points. One interesting aspect of the relationship between southwest and northwest sites is that many of the latter are cache sites, where a number of Clovis points were stashed, possibly for future use. Many of these cached points appear to be made of the same types of Texas tool stone, such as Alibates chert from the Texas panhandle and other more southerly sources. According to recent research by lithicists conducting geochemical analysis of stone sources, it is highly likely that the same peoples who occupied the southwestern sites like Gault travelled hundreds of kilometers north across the Great Plains and Rocky Mountain Front to the sites in the northwest. The points from the northeast cluster in another branch of the dendrogram. This suggests that by the time Clovis technology reached this area of the U.S. and Canada, the shape of Clovis points had changed. This change in tool shape may have occurred when western-originating populations encountered new territory in the northeast and needed to change their technological standards to accommodate different environments with new types of stone, plant resources, or prey animals. Alternatively, if a population of people already inhabited the area, it is possible that the technology was transmitted from peoples in the west to peoples in the northeast, and shape change occurred during the process of transmission. The three clusters also suggest that Clovis peoples were preserving a standardized point shape as they resharpened and refurbished projectile points. This is especially apparent in the northwest cluster (outlined in blue in the figure, above right) and the greater western cluster, where cached points and heavily resharpened points were assigned to the same cluster. The cached points represent pristine specimens, many of which are in early stages of their use life (e.g., Drake, Anzick, and Fenn), whereas points from such sites as Dent, Gault, and Naco likely experienced multiple episodes of resharpening and refurbishment. Although discarded near the end of their use-life, these points retain enough specific shape characteristics to be clustered with the more pristine cached points. It appears, then, that Clovis-point manufacturers did not unsystematically resharpen broken points, but imposed a normative, or preconceived, shape as they resharpened and repaired points throughout their use-lives. As an analytical tool, geometric morphometrics describes shape variation and generates variables for statistical analysis from a series of coordinates that capture the geometry of the entire structure being studied, enabling consideration of entire shape throughout analysis. Not only does geometric morphometrics allow examination of shape variation in a data set, but it also can be used to evaluate how differences in shape co-vary with other variables such as environmental and geographical factors. There are multiple approaches to this method, such as elliptical fourier in addition to landmark placement, and analyses of 3-dimensional representations of objects have also become common. There are many software package available as well. While this analysis used the tps-series of software, other high quality packages include MorphoJ, IMP, and CoordGen. Credits and SourcesThis Spotlight entry was written and programmed for the web by TBH Associate Editor Heather Smith, based on information in the following sources. Photography and figures were made by Heather Smith. Special thanks to Michael Collins and Laura Nightengale at the Texas Archeological Research Laboratory, Michael Waters and Ted Goebel at the Center for the Study of the First Americans at Texas A&M University, and Dennis Stanford and Margaret Jodry at the National Museum of Natural History for access to the collections used in this analysis.
|
|

Adams, Dean C., F. James Rohlf, and Dennis E. Slice Baylac, Michel, and Martin Friess Bookstein, F.L. Bookstein, F.L., B. Chernoff, and R. Elder, Buchanan, Briggs, and Mark Collard Buchanan, Briggs, Eileen Johnson, Richard E. Strauss, and Patrick J. Lewis Ginter, CC, T.J. DeWitt, F.E. Fish, and C.D. Marshall Kilby, David J. Lleonart, Jordi, Jordi Salat, and Gabriel J. Torres Morrow, Juliet E., and Toby A. Morrow O’Brien, Michael J., John Darwent, and R. Lee Lyman Slice, Dennis E. Smith, Heather Smith, Heather, Ashley Smallwood, and Thomas DeWitt Zelditch, M.L., D. Swiderski, H.D. Sheets, and W. Fink
|